High-Protein Dairy-Free Ice Cream: Which Plant Proteins Count and Which Numbers Are Marketing
Published on October 8, 2026
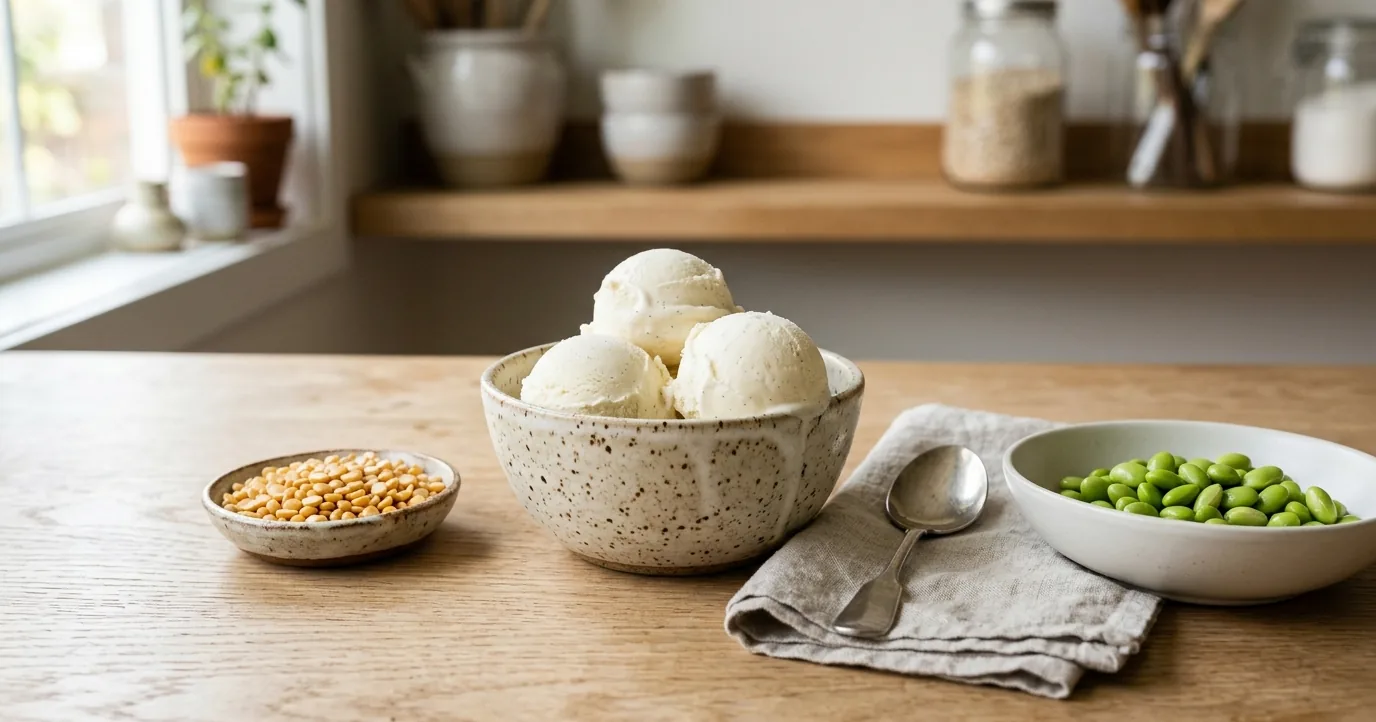
Protein has moved out of the gym bag and into the freezer case. This summer, ingredient suppliers told a food trade outlet that demand for high-protein products is now steering how dairy alternatives get formulated, with manufacturers blending soy, pea and wheat proteins or pairing plant proteins with whey. For a dairy-free shopper who also counts grams, that sounds like progress. The catch is that most dairy-free pints still carry very little protein, the number on the tub says less than it appears to, and the plant proteins that add the most nutrition do strange things to a scoop. Here is how to tell a protein pint worth buying from a protein claim worth ignoring.
Most Dairy-Free Pints Carry Less Protein Than You Think
The most complete map of the freezer case is still a survey by Craig and Brothers, who recorded the nutrition labels of 358 plant-based pints from 48 brands in early 2022. The median pint delivered 2 grams of protein per serving. Only 53 reached 4 grams, the figure the authors give as typical for regular dairy ice cream, and only 34, fewer than one in ten, reached 5 grams.
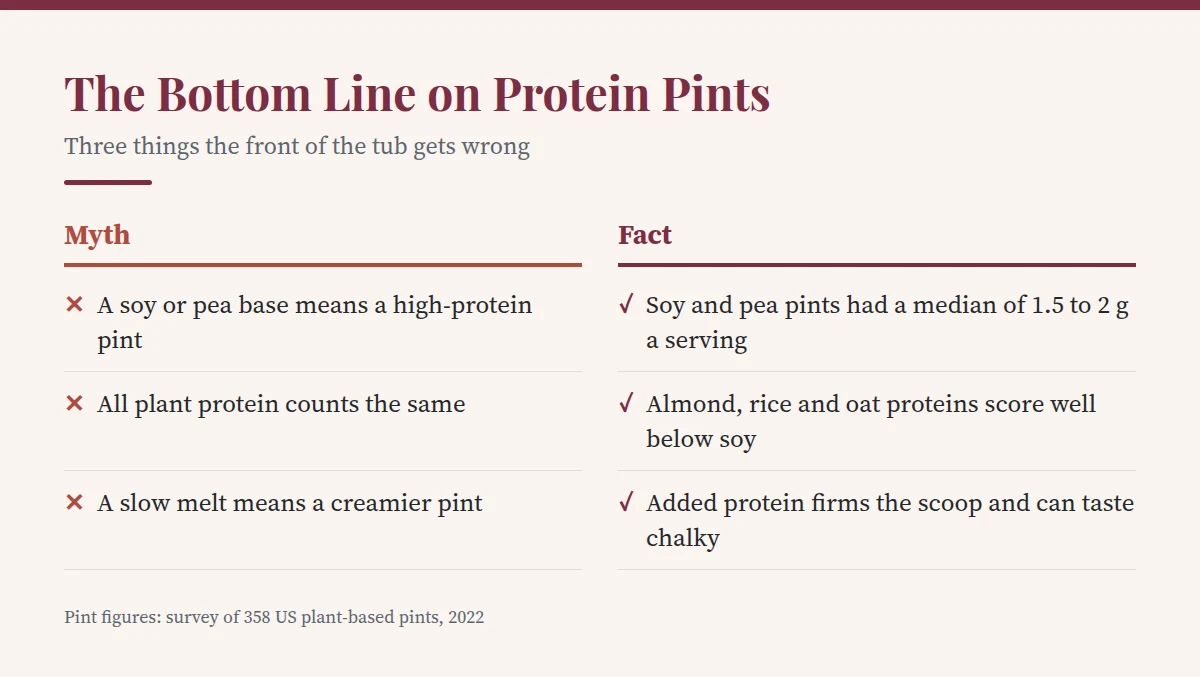
The surprise was which bases came out ahead. Soy and pea make the most protein-rich plant milks, yet the soy pints had a median of 1.5 grams per serving and the pea protein pints 2 grams. Almond and cashew pints did better at 3 grams. The leaders were fruit-based desserts with added hemp protein, nuts or seeds, at 6 to 7 grams. Pea protein turned up in the ingredient lists of 31 percent of the pints, about three times the share that reached 5 grams, so finding it on the list promises nothing about the panel.
The drinks these pints are built from tell the same story. A census of 219 plant milks from 21 US brands, published by Johnson and colleagues, found them generally lower in protein than dairy milk, with wide variation inside every category, and only fortified soy came close to matching milk overall. In a Swiss analysis of 27 plant drinks, Walther and colleagues found that apart from soy, most held 1 percent protein or less. A pint made from a thin base will be thin on protein unless the maker adds protein on purpose.
The survey is four years old and protein-forward pints have launched since, so treat these figures as a baseline rather than a picture of today’s shelf. And keep the stakes in proportion. FDA notes that protein intake is not a public health concern for most Americans over age four, and it does not require a protein %DV on most labels. A protein pint is a fine choice, but it is dessert with a bonus, not a supplement. (I compare plant and dairy pints on sugar, fat and micronutrients in is dairy-free ice cream actually healthier.)

Which Plant Proteins Actually Count
Grams are only half the answer. What matters is how much of that protein your body can use, which depends on two things: whether it supplies the essential amino acids in the proportions people need, and how well it is digested. US labels fold both into one figure, the protein digestibility-corrected amino acid score (PDCAAS), which multiplies an amino acid score by digestibility and caps the result at 1.0. The UN’s Food and Agriculture Organization now recommends a newer measure, the digestible indispensable amino acid score (DIAAS), which checks the digestibility of each essential amino acid separately.
Walther and colleagues scored their Swiss plant drinks this way. Measured against the adult reference pattern, only the soy drinks cleared 100 percent. Every other drink, from almond and rice to coconut, oat and hemp, landed between 39 percent for almond and 79 percent for cashew. Those figures assumed every gram was fully digested, which flatters plant proteins, so the real numbers sit lower still.
Pea was not in that study, but it has a known weak spot. When Ng and colleagues built plant-based ice creams with 7 percent protein, the pea and soy versions came out lower than a milk-protein version in essential amino acids such as methionine. Oat protein falls short on a different one, lysine, as McCarron and colleagues note. Gaps like these are why blends can beat single proteins: in a lab study I covered in what the labs are working on next, a blend of sprouted soy and fermented rice scored better on essential amino acids than soy milk alone.
So the ranking is real, if more modest than the marketing. Soy is the plant protein that comes closest to dairy on quality, which is much of the case I make in my soy ice cream guide. Pea brings real protein with a methionine gap. Almond, rice, oat and coconut proteins count for less than their grams suggest, and those bases rarely carry many grams in the first place.
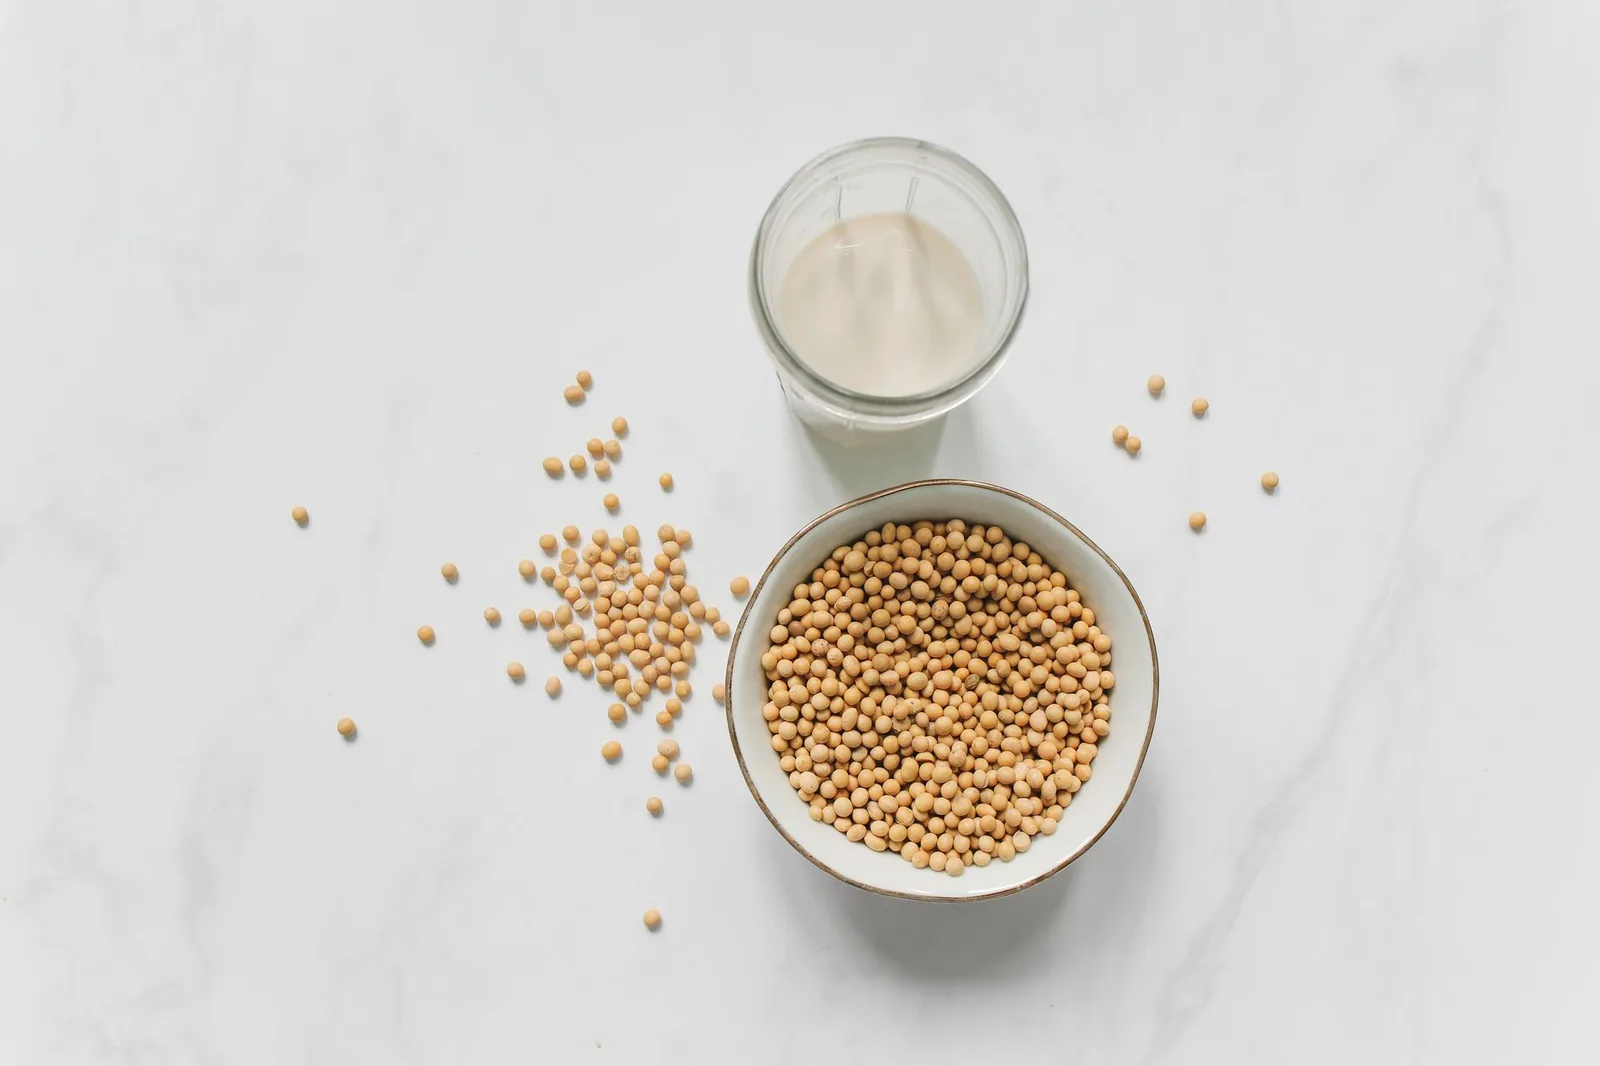
There is one more wrinkle in the gram line itself. US rules let manufacturers estimate protein by measuring nitrogen and multiplying by 6.25. The right factor depends on a protein’s amino acid makeup, which varies from plant to plant, and the Swiss team found that even a more conservative factor of 5.6 overstated the protein in almond, coconut, hemp and rice drinks by 10 to 20 percent compared with the amino acids actually present.
The Numbers on the Tub, and Which Ones Are Marketing
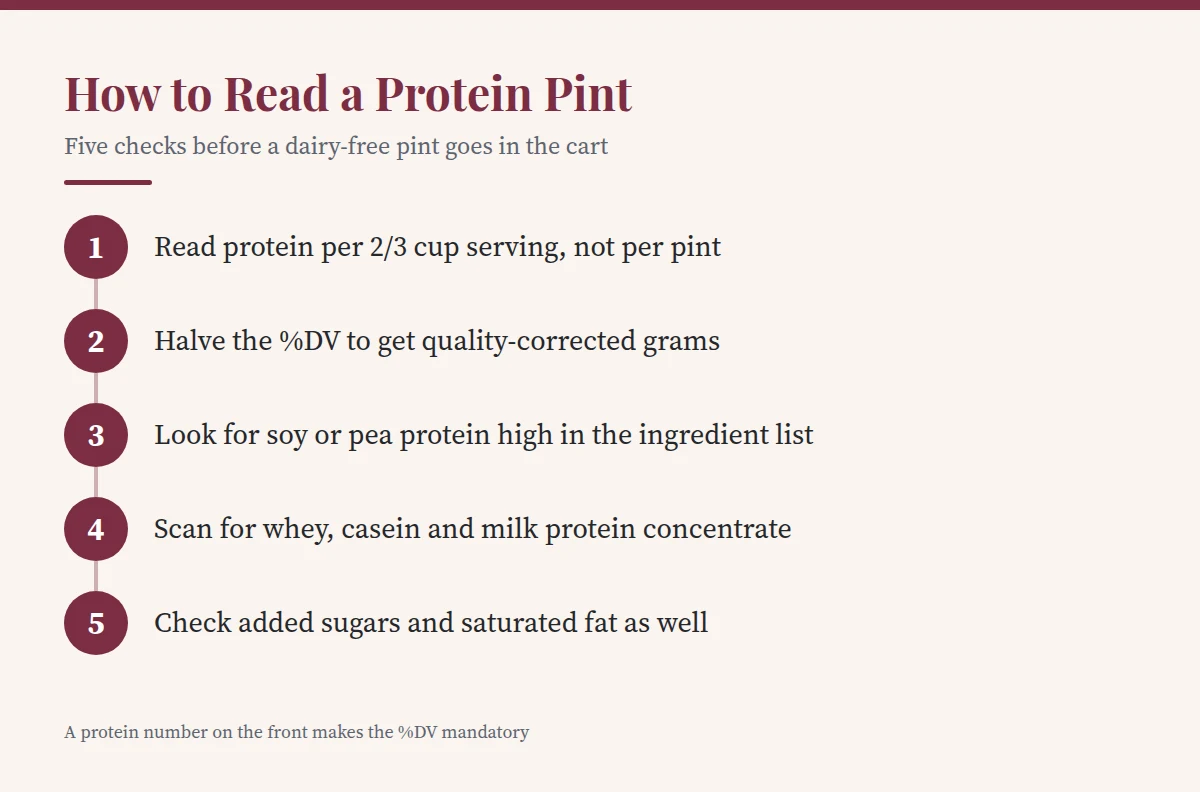
Start with the serving. FDA sets the reference serving for ice cream at 2/3 cup, so a pint holds three, and a pint of ice cream is the agency’s own example of a package that must carry two columns on its panel: one per serving and one per container. A front panel promising “20 grams of protein per pint” is quoting the whole container. Divide by three and you are at 6 or 7 grams a serving, before anyone asks about quality.
Next, find the %DV. On most foods the protein line shows only grams, and that is allowed. But the same figure printed anywhere outside the Nutrition Facts panel counts as a nutrient content claim, so “12 g protein” on the front is a protein claim just as “high protein” is. Once a package makes one, the %DV for protein becomes mandatory, and it cannot be worked out from raw grams. The rule requires multiplying the grams by the PDCAAS, then dividing by the 50 gram Daily Value.
That gives you a quick check in the aisle: halve the %DV to get the quality-corrected grams, then compare them with the gram line. A pint listing 10 grams and 20 percent is delivering protein of full quality. A pint listing 10 grams and 12 percent is delivering about 6 usable grams, a score near 0.6. Rounding blurs the math by a gram or so, but a big gap is the clearest signal on the whole label. A protein number on the front with no %DV on the panel is a labeling gap, and a good reason to doubt the number.
The claim words have legal floors too, measured in corrected protein per 2/3 cup serving. “Good source,” “contains” or “provides” requires at least 10 percent of the Daily Value, which is 5 corrected grams. “High,” “rich in” or “excellent source of” requires 20 percent, or 10 corrected grams. A pint built on a low-scoring protein can print a respectable gram count and still not qualify for either phrase. Ingredient callouts such as “made with pea protein” tell you an ingredient is present, not how much protein reaches you.
Where Milk Hides on the Protein Shelf
Milk protein is the easy route to a high gram count in something that still scoops like ice cream. In the Ng study, the version made with milk protein concentrate came out closest to the dairy reference in both physical and sensory tests, while the pea and soy versions lagged on taste and texture. That gives any maker chasing a protein number a reason to reach for milk, and the suppliers quoted in the trade report describe dairy and plant protein combinations as part of where the category is heading.
So read the protein shelf as if dairy were likely. Milk protein concentrate and isolate, whey protein concentrate and isolate, casein, caseinates and ultra-filtered milk are all dairy. A “lactose-free” protein pint has had its milk sugar dealt with, not its milk protein. Newer pints can also carry whey made by fermentation, sold as animal-free and sometimes labeled vegan, which is still milk protein to an allergic immune system and is declared as milk; I explain why in animal-free dairy and hybrid blends. Check the “Contains” line for milk on every tub, including the ones that say plant-based.
The protein blends suppliers describe add one more allergen to watch. Wheat protein carries gluten, which matters if you are also managing celiac disease and dairy-free ice cream. Soy and wheat are both major allergens that must be named on the package, so the allergen statement will catch them even when the front of the tub does not.
What Extra Protein Does to the Scoop
Protein changes how a frozen dessert behaves, and not always in ways the label hints at. The upside is structure. In the Ng study, pea protein gave the thickest mix and the firmest ice cream, and both pea and soy melted more slowly, held their shape better and slowed ice crystal growth during temperature swings compared with dairy proteins. In a Malaysian study by Hasan and colleagues, a dairy-free dessert made with pea protein melted about 16 times more slowly than an ice cream made with milk protein. A protein pint that stands up on the counter is doing exactly what protein does.
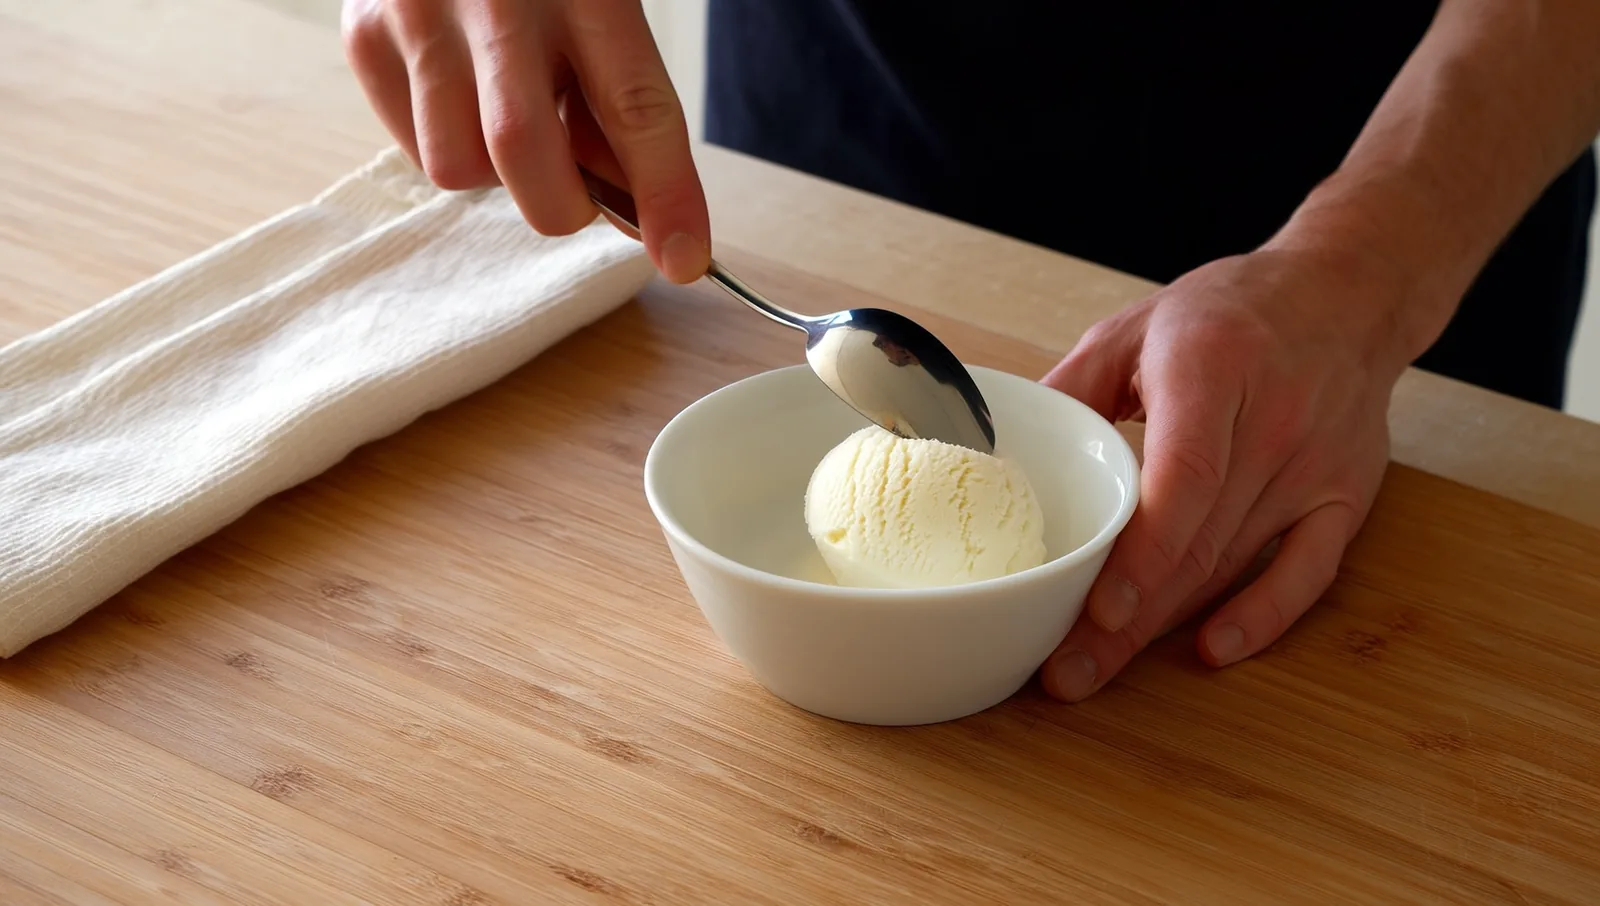
The downside is mouthfeel. Ng and colleagues saw more protein clumping in the pea ice cream, and their tasters rated both the pea and soy versions lower on taste and texture. In a Canadian trial by Ettinger and colleagues with 104 tasters, desserts enriched with pea protein on cashew and coconut bases came across as more cohesive and sticky, and less slippery, than a dairy version enriched with whey. Those samples were thickened for people with swallowing difficulties, so treat the result as a direction rather than a verdict on retail pints.
What people call chalky has a scientific name, astringency: the dry, rough feeling strong tea leaves behind. Kew and colleagues at the University of Leeds had 100 tasters sample plain mixtures of pea, potato and lupin protein. At 15 percent protein, pea was rated the roughest, grainiest, most mouth-coating and most astringent of the three, and ten seconds after tasting its astringency had grown while its creaminess faded. Mixing proteins did not prevent it. The team traced the effect to pea protein binding to proteins in saliva, much as tannins do. When McCarron and colleagues added pea protein to an oat drink, it brought a bitter, metallic taste and an astringent aftertaste, while potato protein left a powdery coating (one co-author works for a dairy company). And in an Ohio State study of 13 pea protein isolates, bitterness, grainy cereal notes and astringency were what pulled consumer liking down.
None of this makes protein pints bad. It means you should expect a firmer, denser scoop that melts slowly, give the tub a few minutes on the counter before serving, and judge the flavor on a single pint before you stock up.
The Bottom Line
The front of a dairy-free protein pint tells you the least. Read protein per 2/3 cup serving, find the %DV and halve it, and look for soy or pea protein near the top of the ingredient list rather than at the bottom. Then read the list again for milk proteins, because the protein shelf is where dairy is most likely to slip in. Expect a firmer scoop and a slower melt, and do not let the grams distract you from the sugar and saturated fat lines. Recipes and suppliers change, so check the label on every tub, even the one you bought last month.
Further reading (sources)
- Craig and Brothers on the nutrition labels of 358 plant-based frozen dessert pints
- Walther and colleagues for protein content and amino acid scores of plant drinks against cow’s milk
- Johnson and colleagues with a census of 219 plant milks sold in the United States
- Ng and colleagues on plant-based ice cream made with pea, soy and milk proteins
- Hasan and colleagues for melt rates of frozen desserts made with rice, pea and soy proteins
- Ettinger and colleagues, testing thickened, protein-enriched plant-based frozen desserts
- Kew and colleagues on why plant proteins feel astringent in the mouth
- McCarron and colleagues with what pea and potato protein do to an oat drink
- Kim and colleagues on the flavors and textures that drive liking of pea protein isolates
- U.S. Food and Drug Administration on when a protein %DV is required on the Nutrition Facts label
- U.S. Food and Drug Administration explaining the 2/3 cup ice cream serving and dual-column pint labels
- Code of Federal Regulations on the protein declaration and quality-corrected %DV in 21 CFR 101.9
- Code of Federal Regulations defining nutrient content claims, on and off the panel, in 21 CFR 101.13
- Code of Federal Regulations setting the “good source” and “high” thresholds in 21 CFR 101.54
- Food Ingredients First reporting ingredient suppliers on protein and hybrid trends in dairy alternatives